
The Clutchest NBA Players in the 2014/15 Season
This NBA season has seen emerging superstars rise to the pinnacle of the sport. Steph Curry, James Harden, Russell Westbrook and Anthony Davis have all had career-best seasons and are front-runners for the league’s MVP award.
With the playoffs beginning this week, however, the game’s elite need to translate their stellar play into wins. They need to elevate their game when the game is on the line. Their legacies will be defined not by how good they are, but how clutch they are.
How can we determine if the superstars of the NBA are clutch? How do we know if a player can make that buzzer-beater to clinch the series (think Damian Lillard) or shoot the must-make three-pointer to stay alive (think Ray Allen)? We came up with two metrics that can help us quantify “clutchness” in the NBA. The first is Win Shares and the second is Win Probability Added (WPA).
Method 1: Predicting “Win Share” in Clutch Situations
“Win Shares” estimates the number of wins a player contributes to a team. Basketball-reference.com uses advanced formulas to compute this statistic, but these advanced formulas cannot be applied to close game situations. To simplify the win share calculation and extend it to moments when the game is on the line, we regress the metric with available player statistics (e.g. Field Goals, Rebounds, Assists etc.) to find the best model that predicts win shares for each player. We define clutch situations as possessions occurring at less than 3 minutes left in the 4th quarter or overtime and within a 5 point margin.
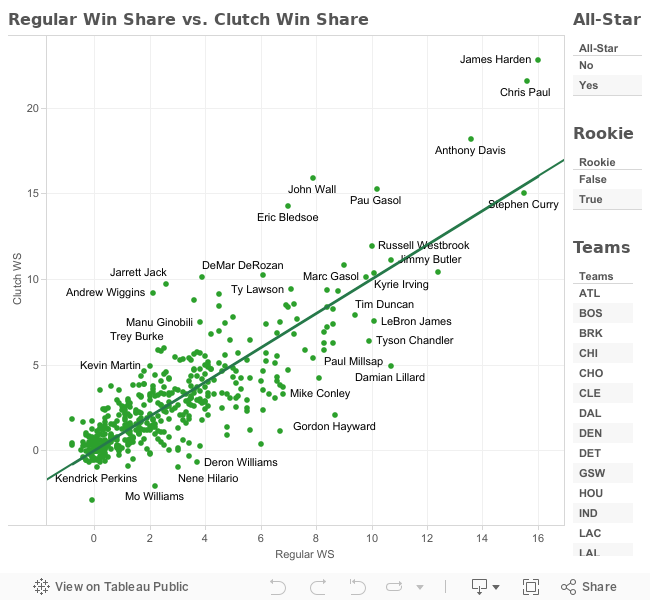
With our regression model, we were able to predict players’ “clutch win shares." The results, seen below, show some very interesting findings:
- James Harden is the best and the clutchest, with the highest regular and clutch win share. Players perform better in tight situations if they are situated above the 45-degree line, and Harden is way above it.
- The clutchest player that is not an All-Star is Eric Bledsoe. His win share in close situations is double of his regular win share, good enough to be ranked 6th in the league.
- The Golden State Warriors team is not that clutch. Its superstar, Steph Curry, actually performs slightly worse in late-game situations. That said, one can argue that they have been so good this year, that they have not been in many clutch situations
- Andrew Wiggins has the makings of a superstar. While he only has a 2.10 regular win share, his clutch win share is over 9, putting him in the top 20 in the league.
- Some “clutch” players aren't really that “clutch.” Damian Lillard,Blake Griffin,Kyle Lowry has been known to carry their team in tight situations. Our predictions suggest otherwise, as they all fall below the 45-degree line. On the other hand, heavily criticized John Wall is the fourth best player in close games.
- Kyrie Irving, not Lebron James, should be the go-to guy for the Cleveland Cavaliers when the game is on the line. His 50+ efforts against the Spurs and Blazers probably helped his case.
Method 2: Calculating Total Win Probability Added in Clutch Situations
“Win probability added” (WPA) is a metric commonly used to analyze player performance in baseball and American football. It measures how much a play affects the team’s probability of winning. For instance, if the game is tied with 10 seconds remaining in the fourth quarter, draining a three-pointer bumps up the team’s probability of winning by an astonishing 30.7%, so the WPA for that play is 30.7. However, missing that three-pointer bumps down this probability by 23.4%, so the WPA for that play is -23.4.
We used Inpredictable.com’s win probability calculator to determine these changes in winning probability for each possession.
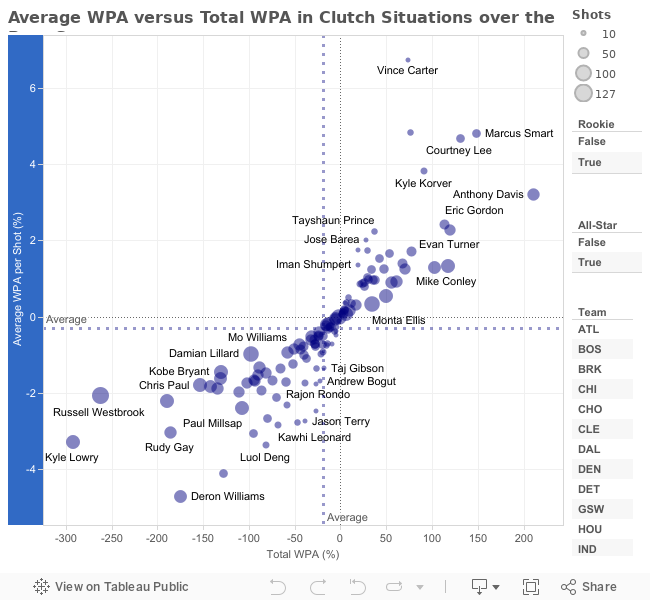
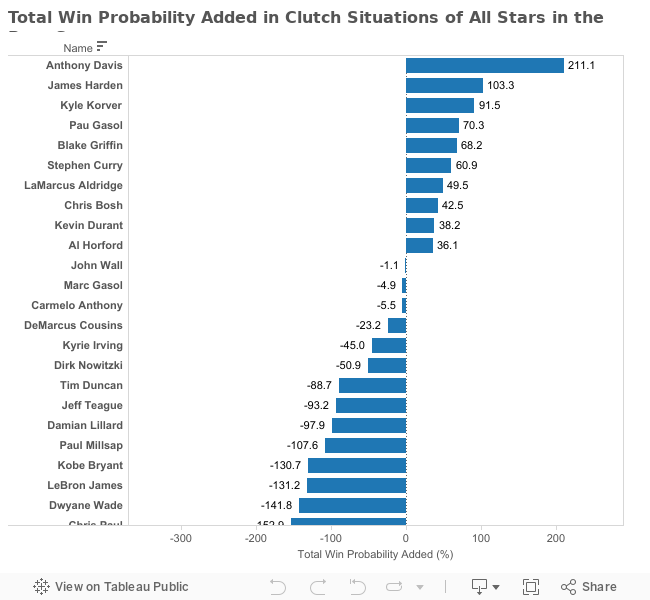
Our method calculates the WPA for every shot attempt in a clutch situation for each player. We then aggregate these possessions to get the total WPA for each player. We also calculated WPA per shot attempt to determine player efficient in tight game situations. The results, shown in the graphics below, reveal some interesting findings:
- Anthony Davis is the clutchest player for this metric, with the highest win probability added, at 211.1. James Harden contributed less than half of that despite attempting more shots (66 vs. 80).
- Many superstars (Chris Paul, Russell Westbrook, Kyle Lowry) have very bad WPA. A lot of them are forced to take difficult shots in tight situations, and as a result, are heavily penalized.
- Vince Carter, at the age of 38, contributes the most win probability per attempted shot. While he may not have the explosiveness he once had, he can still make the big shots when it matters.
- Marcus Smart, is not only one of the best rookies, but one of the clutchest NBA players, period.
- Kyle Korver is just as effective on the three-point line as he is in clutch situations, topping the charts in win probability added per attempted shot among all-stars.
So who are the clutchest players in the NBA?
Both of these methods add valuable insights to how clutch players are. That said, the Win Share method emphasizes overall player performance over the final minutes of the game, whereas the WPA method emphasizes the player’s ability to make an important shot, especially in the dying seconds when it really matters. Scoring a buzzer-beater will significantly alter a player’s WPA score, but not his win share score. On the other hand, assisting another player would increase a player’s win share score, but not his WPA score.
Looking at the two methods, two players stand out for us - Anthony Davis and James Harden.
Both rank in the top 10 in Clutch Win Share and Total WPA. We would bet on these two players to step it up when the game is on the line.
These metrics, however, should be considered with context. Some players with a lower clutch win share or total WPA than others may more heavily defended because of the positions they are playing - a shooting guard will be in the paint more than a point guard and thus have a lower WPA per shot. Other things to consider are how many clutch situations a team is in. A good team may not have a scoring margin between -5 and 5 with 3 minutes remaining very often, and their players will have a lower total WPA.
The code for this analysis is included in Github:

