A Point by Point Breakdown of Men's Professional Tennis
Since Rafael Nadal rose to prominence when I was 12 years old, I have followed the ATP World Tour in immaculate detail. I would check the ATPWorldTour website whenever I could, and on the off chance that my local sports channel was broadcasting a tennis match, my eyes would be glued to the television screen.
Every time I see a live tennis score though, the numbers side of me would always ask myself about odds. What is the chance that this player will win with this set and a break lead? What are the odds that Federer will come back from two sets to love down against Rafa at Wimbledon? What's the probability that Sam Querrey will pull off the upset against Novak Djokovic after losing the third set this year (thank god he did)?
While I cannot answer these questions on a matchup by matchup basis given the two free days I have, I've managed to answer odds-related question on a point by point basis. By extracting 2011-2015 ATP World Tour and ATP Challenger Tour best-of-three matches data from Jeff Sackmann's well-maintained database, I managed to group all similar points together and calculate the winning percentage of all possible tennis match situations. The results are visualized in the dashboard below:
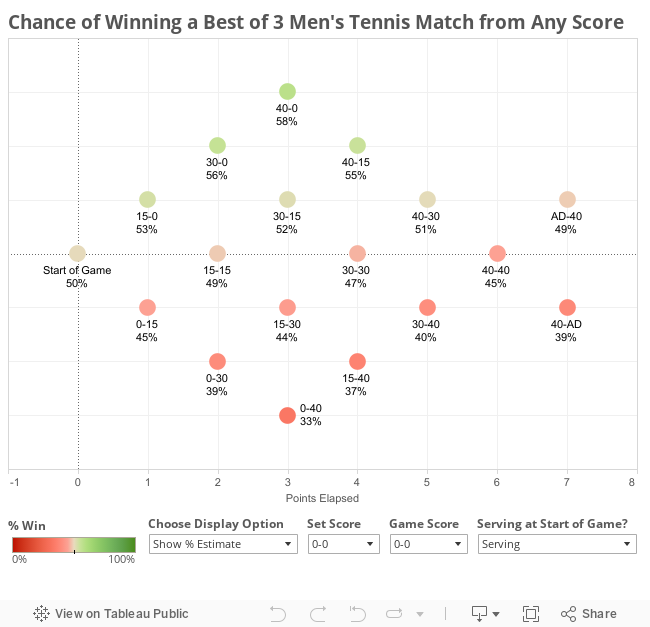
Each view represents a particular game in a match, which can be tweaked using the dropdown menus at the bottom of the dashboard. Each node represents a particular score within that game (organized along the x-axis by points elapsed, and along the y-axis by lead margin), and each node has a probability of victory associated with it. The probability of victory can be represented as either as an estimate or as a range, which is the 95% confidence interval of our estimate based on the existing data and the size of the existing data.
There are several interesting observations from these results that I would like to point out:
1) It is questionable if points matter more towards the end of a set, especially when at parity.
By visually inspecting the node graphs when serving at 1-1, 2-2, 3-3, 4-4 and 5-5 in the third set, we would expect the graphs to show more polarizing probabilities as the games go higher. However, the differences are barely noticeable.
This observation may explain many possibilities. It may mean that every point does matter fairly equally no matter the stage of the match in professional tennis. It may also mean that breaks are rare in men's tennis and that even early breaks does not in fact give trailing players a bigger chance to come back to win. It can also mean that inferior players have a similar chance of getting broken earlier on in the set as later on in the set. More analysis will be needed to further interpret this finding.
2) There is no advantage to serving first in any set.
By inspecting the start of game nodes for all parity situations (i.e. 1-1, 2-2, 3-3, 4-4, 5-5, and 6-6) in the first and third sets, the server in these cases all have a 50% chance of winning. The only slight advantage you get for serving first is serving first during the tiebreak. At 1-1, 2-2 and 3-3 in the first set tiebreak, chances of victory are at 51%, 53% and 51% respectively. While that indicates some disparity, the ranges (49-53%, 50-55% and 48-53%) all suggests that this disparity is not significant enough to warrant a clear advantage to the player who served first in the tiebreaker.
It would be interesting, though, to see whether the disparity is significant when filtered for a particular player. For instance, Roger Federer is known to choose to serve first, while Rafael Nadal always chooses to return first. It may be worthwhile to see their win probabilities given their "ideal" and "non-ideal" scenarios.
3) The largest one-point probability swings occur (as expected) in the third set tiebreaker.
In fact, the largest upward swing occurs at extra points in the final set breaker (can be 6-6, 7-7, 8-8, whatever.... we label it in the visualization as 6-6), when the player is returning. At that point, the player has 51% chance of winning, but if he wins the return point, he has a chance to serve for the match, raising his win probability to 81%, a 30% increase. (Obviously if you are on the other side of the net, this would be the largest downward swing).
The second largest upward (downward) swing occurs when the player is down 5-6 in the tiebreak with his opponent serving for the match. At that point, the player has a mere 22% chance of winning. But if he wins the point, his prospects shoot up to 51%.
The coolest thing about this is that a player can actually experience the two largest upward (or downward) swings in a three-set tennis match in two consecutive points. In other words, their chances of winning the match can soar up to 59% by winning two return points in a row. How crazy is that?!
To give you guys even more context, the numbers imply that 43% of all players in this 5-6-down situation manage to save the match point, and 36% of all players in the 6-6 returning situation manage to get themselves to 7-6, which suggest that the miraculous 59%turnaround is actually not that unlikely at all!
Do you guys have any other interesting findings from this dashboard? Feel free to point them out in the comment section below - thanks for reading!